| Background on Platinum Group Metals: Issues and Opportunities
Understand the Markets
View Table of Contents
Download Brochure (includes TOC)
|
Platinum Group Metals: Issues and Opportunities
Thintri, Inc. announces the release of Platinum Group Metals: Issues and Opportunities, a new market study that surveys current market conditions in platinum group metals (PGMs), and analyzes emerging demand, supply constraints and price volatility. The report also explores opportunities generated by new techniques of PGM recovery from previously-unused resources, and opportunities created by development of new, much less
costly substitutes.
The report separates hype from reality and assesses the dramatically changing landscape facing PGM users and suppliers. Forecasts are supplied for demand and prices under current conditions going out to 2022, as well as an analysis of the effects of
new technologies for PGM
replacement and recovery.
Background on PGMs
Sourcing and Suppliers
Applications
- Automotive and Transportation
- Electronics/Electrical
- Medical/Dental
- Industrial and Scientific
- Jewelry, Investment and Coinage
The Supply Side
- Potential Shortages and Supply Threats
- Response to Shortages
- Political Issues
- Long-Term Solutions
The Demand Side
- The Automotive Demand Driver
- The Jewelry and Investment Demand Drivers
- The Petroleum Demand Driver
- Industrial Demand Drivers
- Medical/Biomedical/Dental Demand Drivers
- Other Demand Drivers
- PGM Demand by element
—Platinum
—Palladium
—Rhodium
—Iridium
—Ruthenium
—Osmium
—Influence of Alternative
- Energy Schemes
- Projected Price Trends
PGM Replacement
- Precious Metals and Reduced-PGM Alternatives
- PGM-Free and Reduced PGM Autocatalysts
- Alternatives Based on Conventional Chemistry
- Alternatives Based on Nanotechnology
- Electrolysis Catalyst Alternatives
- Impact of Alternatives on PGM Demand and Price
Scrap and Recovery
- Improved Recycling Schemes
- Slag and Mine Waste
Background on Platinum Group Metals: Issues and Opportunities
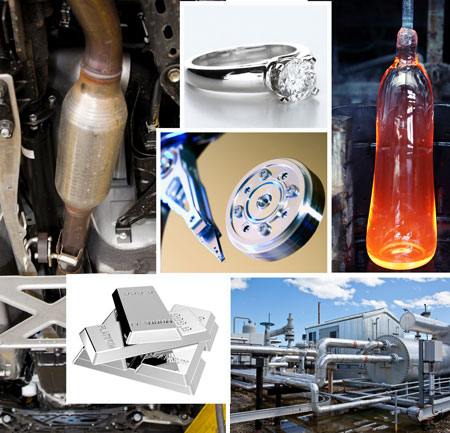
Platinum group metals (PGMs), namely platinum, palladium, rhodium, iridium, ruthenium and osmium, are rare, expensive and critical to today’s economy. Up to now, there have been no other materials that can duplicate their performance in fundamental applications. Those applications include autocatalysts, the critical components in the catalytic converters found in most vehicles that reduce harmful emission; catalysts used in a broad range of industrial processes, including petroleum refining; high-temperature processing of abrasive materials such as glass; disc drives and electronic components; medical and dental implants and devices; and electrochemistry. Of course, selected PGMs are also highly prized in jewelry and investment.
Prices of PGMs are high and notoriously volatile. Rhodium, for example, went from slightly over $6,000 per ounce in mid-2007, to $10,000 per ounce in mid-2008 and then crashed to a little above $1,000 before the end of that year. While this degree of fluctuation is exceptional, it’s emblematic of the behavior of critical materials in limited supply, tied to broader economic forces like auto sales.
At this time of growing markets, the limits of supply are becoming clear. Like most natural resources, PGM supplies are inherently limited. Concerns about “peak metals,” the idea that availability has peaked for limited resources and future production will be reduced and/or more costly (which has already occurred for a number of important minerals), will soon be an important influence with PGMs. Already, palladium has entered a period of supply uncertainty and political destabilization.
Tightening of supplies comes at a time of accelerating demand. Growth of auto sales and industrialization in the developing world, particularly Brazil, Russia, India and China (the BRIC countries), as well as interest in PGM jewelry and investment by newly-prosperous populations, will place significant stress on available supplies. In addition, tightening environmental restrictions worldwide are forcing the use of more PGMs per vehicle to meet emissions rules. Furthermore, building of new oil refineries and industrial growth in a recovering economy will put further stress on supplies. Other demand drivers like medicine and petroleum, which are functions of aging populations and global economic shifts, will place stress on PGM supplies as well.
Analyses indicate that presently-known platinum reserves are sufficient for another 360 years at present rates of production and consumption. However, that estimate drops to 15 years if growing demand, particularly from growing industrialization and automobile sales in the developing world, is taken into account.
With demand growth, inelasticity of supply will likely force up prices in this decade dramatically
The response to scarcity will no doubt include reduction in PGM consumption through “thrifting,” i.e, the devising of ways to use less PGMs in established applications (which has been underway for decades). Also, rising prices will mean that deposits with lower PGM content such as those in Australia, which had been too costly to exploit in the past, will now be profitably mined, to some degree mitigating that price increase.
Another consequence will be the development of high performance, low cost alternatives, and in improved recycling and recovery.
Alternatives are sometimes as simple as substituting a less expensive PGM, such as palladium, for a more expensive one, such as platinum, although, as seen in 2017, this can force the price of palladium past that of platinum. The more significant alternatives use nanotechnology with inexpensive materials such as nickel, to fine tune the properties of nanoparticles by controlling parameters such as diameter. Inexpensive nanomaterials can substitute for PGMs in some of the most important markets, such as catalysts in the automotive and industrial markets. PGM usage in some applications, such as jewelry and electronics, is relatively immune from substitution, but most applications are vulnerable.
Recycling will become more important as PGM prices rise. Newly available technologies are able to dramatically improve the amount of PGMs that can be captured from recycled products such as catalytic converters.
Other recently developed processes are able to extract significant quantities of PGMs from mine waste that contains much higher PGM concentrations than the best quality ores. Mountains of slag and mine waste in North America and worldwide contain enough PGMs to significantly impact the supply/demand/price picture for PGMs once exploited.
Alternatives that can capture markets directly from PGMs, and new technologies that can dramatically improve PGM recovery from recycled materials and mine waste, are already commercially available or very near commercialization and will exert a growing influence on markets now owned by PGMs and PGM prices and availability.
The confluence of growing demand, limited and/or dwindling supplies, and growing availability of alternatives and new supplies will likely create a period of extraordinary volatility before things stabilize. Most of the time during the forecast period will witness the transition of established PGM markets as prices rise and users adjust to new conditions, while others take advantage of the new opportunities presented.
Understand the Markets
Platinum group metals are at an extraordinary intersection of market forces. Their rarity and expense has largely confined them to a limited set of markets. Those markets, in turn, are largely dependent on PGMs simply because there have been no viable, and cheaper, alternatives. The inelasticity of supply has led to occasionally extreme volatility in the past. Today, growing demand, fueled by a range of factors that include accelerating motor vehicle sales around the world, a rising industrial sector in the developing world and a growing consumer preference for white metals in jewelry, while supplies are relatively fixed and in some cases declining, threatens to put PGMs in an even more volatile situation. As demand exceeds available supplies, prices can be expected to rise significantly.
The Thintri market study, Platinum Group Metals: Issues and Opportunities, relies on in-depth interviews with industry executives, market development managers and government and academic researchers. The report provides a survey of the current state of the PGM markets, an assessment of viable alternatives and recovery schemes, and discussion of the effects of growing demand on availability and prices, and the effects on those prices of PGM replacement technologies and improved recovery methods.
 |
Order today
#PGM2—Platinum Group Metals: Issues and Opportunities
Price: $4,300
|
|
Report Table of Contents:
EXECUTIVE SUMMARY: PLATINUM GROUP METALS 1
E.1 Introduction 1
E.2 Applications 1
E.3 Supply, Demand and Price Issues 2
Figure E-1 Source Countries of PGMs 3
Figure E-2 Platinum Demand Forecast, Autocatalysts 4
Figure E-3 Palladium Price Forecast 5
E.4 PGM Replacement and Improved Recovery Methods 5
Figure E-4 Total Rhodium Displaced by Alternatives 6
Figure E-5 Resulting Rhodium Price, After Alternatives 7
PART 1 HISTORY & BACKGROUND 8
1.1 Introduction 8
Table 1-1 Platinum Group Metals and Characteristics 8
Figure 1-1 Periodic Table of the Elements with PGMs Highlighted 9
Table 1-2 PGM Prices, September, 2017 10
1.2 The Elements 11
1.2.1 Platinum 11
1.2.2 Palladium 13
1.2.3 Rhodium 14
1.2.4 Iridium 15
1.2.5 Ruthenium 16
1.2.6 Osmium 17
1.3 Sourcing 18
1.3.1 Extraction 18
1.3.2 Major Producers 19
PART 2 APPLICATIONS 21
2.1 Electronic components 21
2.2 Medical & Dental 23
2.3 Industrial and Scientific 24
2.3.1 General Industrial 24
2.3.2 Glass Manufacture 26
2.3.3 Scientific 27
2.4 Automotive: Catalytic Converters, Spark Plugs
and Sensors 28
2.5 Jewelry 29
2.6 Investment and Coinage 31
2.7 Catalysts 32
2.7.1 Catalysts: Industrial 32
2.7.2 Catalysts: Petroleum and Petrochemicals 34
2.7.3 Catalysts: Automotive 34
2.7.4 Catalysts: Fuel Cells 39
Figure 2-1 PEMFC Fuel Cell Operation 40
PART 3 THE SUPPLY SIDE: PGM SUPPLIES, PEAK MATERIALS
AND SCARCITY 45
3.1 Today’s PGM Sources 45
Figure 3-1 PGM Production by Country 45
Figure 3-2 Platinum Production by Country 45
Figure 3-3 Palladium Production by Country 46
Figure 3-4 Other PGM Production by Country 46
3.2 Peak Metals & Scarcity 47
Table 3-1 Minerals That Have Already Peaked 48
3.3 Response to Shortages 49
3.4 Lessons from the 1970s Cobalt Crisis 50
3.5 Political Issues 51
3.6 Today’s Price/Supply Threats 52
3.7 The Case of Palladium 54
PART 4. THE DEMAND SIDE: MARKET GROWTH AND
PRICE TRENDS 59
4.1 Introduction 59
4.2 The Automotive Demand Driver 59
4.2.1 The Automotive Market Today 59
4.2.2 Electric Vehicles and Their Impact 63
4.2.3 Outlook for the Future 64
Figure 4-1 Platinum Demand by Region,
Autocatalysts, 2018 65
Figure 4-2 Palladium Demand by Region,
Autocatalysts 2018 65
Figure 4-3 Platinum Demand Forecast, Autocatalysts 66
Figure 4-4 Platinum Demand Forecast by Region,
Autocatalysts 66
Figure 4-5 Palladium Demand Forecast – Autocatalysts 67
Figure 4-6 Palladium Demand Forecast by Region,
Autocatalysts 67
Figure 4-7 Rhodium Demand Forecast, Autocatalysts 68
4.3 The Jewelry and Investment Demand Drivers 68
Figure 4-8 Platinum Demand by Region, Investment
and Jewelry, 2018 70
Figure 4-9 Palladium Demand by Region, Investment
and Jewelry, 2018 70
Figure 4-10 Platinum Demand Forecast – Investment
and Jewelry 71
Figure 4-11 Palladium Demand Forecast – Investment
and Jewelry 71
4.4 The Petroleum Demand Driver 71
Figure 4-12 Platinum Demand by Region, Petroleum 2018 72
Figure 4-13 Platinum Demand Forecast, Petroleum 72
4.5 Industrial: Chemical, Electrical, Electrochemical and Glass Demand Drivers 73
Figure 4-14 Platinum Demand by Region, Chemical and Glass 2018 73
Figure 4-15 Palladium Demand by Region,
Chemical 2018 73
Figure 4-16 Platinum Demand Forecast, Chemical and Glass 74
Figure 4-17 Palladium Demand Forecast – Chemical 74
Figure 4-18 Rhodium Demand Forecast – Chemical
and Glass 75
Figure 4-19 Platinum Demand Forecast, Electrical 75
Figure 4-20 Palladium Demand Forecast – Electrical 76
Figure 4-21 Rhodium Demand Forecast - Electrical 76
Figure 4-22 Iridium Demand Forecast, Chemical, Electrical and Electrochemical 77
Figure 4-23 Ruthenium Demand Forecast, Chemical,
Electrical and Electrochemical 77
4.6 Medical, Biomedical and Dental Demand Drivers 77
Figure 4-24 Platinum Demand by Region,
Biomedical 2018 78
Figure 4-25 Platinum Demand Forecast – Biomedical 78
Figure 4-26 Palladium Demand by Region, Dental 2018 79
Figure 4-27 Palladium Demand Forecast, Dental 79
4.7 Other Market Drivers 79
Figure 4-28 Platinum Demand by Region, Other Applications 2018 80
Figure 4-29 Palladium Demand by Region, Other Applications 2018 80
Figure 4-30 Platinum Demand Forecast, Other Applications 81
Figure 4-31 Palladium Demand Forecast, Other Applications 81
Figure 4-32 Rhodium Demand Forecast, Other Applications 82
Figure 4-33 Iridium Demand Forecast, Other Applications 82
Figure 4-34 Ruthenium Demand Forecast, Other Applications 83
4.8 PGM Demand by Element 83
4.8.1 Platinum 83
Figure 4-35 Platinum Demand by Application, 2018 84
Figure 4-36 Platinum Demand by Region, 2018 84
Figure 4-37 Global Platinum Demand Forecast 85
Figure 4-38 Global Platinum Demand Forecast by Region 86
4.8.2 Palladium 86
Figure 4-39 Palladium Demand by Application, 2018 87
Figure 4-40 Palladium Demand by Region, 2018 87
Figure 4-41 Global Palladium Demand Forecast 88
Figure 4-42 Global Palladium Demand Forecast by Region 88
4.8.3 Rhodium 88
Figure 4-43 Rhodium Demand by Application, 2018 90
Figure 4-44 Rhodium Demand Forecast 90
4.8.4 Iridium, Ruthenium and Osmium 90
Figure 4-45 Iridium Demand by Application, 2018 91
Figure 4-46 Iridium Demand Forecast 91
Figure 4-47 Ruthenium Demand by Application, 2018 92
Figure 4-48 Ruthenium Demand Forecast 92
Figure 4-49 Osmium Demand by Application, 2018 93
Figure 4-50 Osmium Demand Forecast 93
4.9 Effects of Alternative Energy Schemes and the
Hydrogen Economy 93
Figure 4-51 Production of Hydrogen, Shares by Method 95
PART 5. PRICE TRENDS 97
5.1 Introduction and Methodology 97
5.2 Influences on Near-Term PGM Price 97
5.3 Trends Up To Today 98
5.4 Platinum 99
5.5 Palladium 102
5.6 Rhodium 104
Figure 5-1 Recent Rhodium Price History 106
5.7 The Investment Picture 108
5.8 Projected Price Trends 108
Figure 5-2 Price Trends, Platinum 109
Figure 5-3 Price Trends, Palladium 109
Figure 5-4 Price Trends, Rhodium 110
Figure 5-5 Price Trends, Iridium 110
Figure 5-6 Price Trends, Ruthenium 111
Figure 5-7 Price Trends, Osmium 111
PART 6. PGM REPLACEMENT 112
6.1 Introduction 112
6.2 Precious Metals as Alternatives and Reduced
PGM-Schemes 113
6.2.1 Precious Metal-Based Substitutes in
Autocatalysts 114
6.2.2 Jewelry 116
6.3 PGM-Free and Reduced PGM Autocatalysts 117
6.3.1 Alternatives Based on Conventional Chemistry 118
6.3.2 Alternatives Based on Nanotechnology 119
6.4 Electrolysis and Fuel Cell Catalyst Alternatives 122
6.4.1 Research Progress 123
6.4.2 Nanotechnology: Catalysts Based on
Nanoparticles and Nanotubes 127
6.5 Impact of Alternatives on PGM Demand and Price 131
6.5.1 Effects of Platinum Alternatives 132
Figure 6-1 Platinum Demand, Conventional Forecast 133
Figure 6-2 Platinum Demand Not Susceptible to
Replacement 133
Figure 6-3 Autocatalysts: Platinum Displaced by
Alternatives 134
Figure 6-4 Chemical: Platinum Displaced by
Alternatives 134
Figure 6-5 Petroleum: Platinum Displaced by Alternatives 135
Figure 6-6 Total Platinum Displaced by Alternatives 135
Figure 6-7 Resulting Platinum Demand After Alternatives 136
Figure 6-8 Resulting Platinum Price, After Alternatives 136
Figure 6-9 Demand for Platinum Alternatives 137
6.5.2 Effects of Palladium Alternatives 137
Figure 6-10 Palladium Demand, Conventional Forecast 137
Figure 6-11 Palladium Demand Not Susceptible to
Replacement 138
Figure 6-12 Autocatalysts: Palladium Displaced by
Alternatives 138
Figure 6-13 Chemical: Palladium Displaced by
Alternatives 139
Figure 6-14 Total Palladium Displaced by Alternatives 139
Figure 6-15 Resulting Palladium Demand After Alternatives 140
Figure 6-16 Resulting Palladium Price, After Alternatives 140
Figure 6-17 Demand for Palladium Alternatives 141
6.5.3 Effects of Rhodium Alternatives 141
Figure 6-18 Rhodium Demand, Conventional Forecast 141
Figure 6-19 Rhodium Demand Not Susceptible to
Replacement 142
Figure 6-20 Autocatalysts: Rhodium Displaced by
Alternatives 142
Figure 6-21 Chemical: Rhodium Displaced by Alternatives 143
Figure 6-22 Total Rhodium Displaced by Alternatives 143
Figure 6-23 Resulting Rhodium Demand After Alternatives 144
Figure 6-24 Resulting Rhodium Price, After Alternatives 144
Figure 6-25 Demand for Rhodium Alternatives 145
6.5.4 Effects of Alternatives in Hydrogen Fuel Cell
Catalysis 145
Figure 6-26 Effect of Alternatives on PGM Demand
in Hydrogen Fuel Cells 146
PART 7. OPPORTUNITIES IN RECYCLING AND RECOVERY 147
7.1 Introduction 147
7.2 Scrap & Recycling 147
Table 7-1 Energy Savings from Processing Scrap
Compared with Ore 148
7.2.1 Electronics and Electrochemistry Scrap 152
7.2.2 Automotive Scrap 153
7.2.3 Market Opportunities in PGM Recycling 155
Figure 7-1 Realized Scrap Volume: Platinum,
Autocatalysts & Jewelry 155
Figure 7-2 Realized Scrap Volume: Platinum, Other
Applications 155
Figure 7-3 Unrealized Scrap Volume: Platinum,
Autocatalysts & Jewelry 156
Figure 7-4 Unrealized Scrap Volume, Platinum,
Other Applications 156
Figure 7-5 Realized Scrap Volume: Palladium,
Autocatalysts, Electrical & Jewelry 157
Figure 7-6 Realized Scrap Volume: Palladium,
Chemical, Dental & Other 157
Figure 7-7 Unrealized Scrap Volume: Palladium,
Autocatalysts, Electrical & Jewelry 158
Figure 7-8 Unrealized Scrap Volume: Palladium,
Chemical, Dental & Other 158
Figure 7-9 Realized Scrap Volume: Rhodium,
Autocatalysts & Chemical 159
Figure 7-10 Realized Scrap Volume: Rhodium,
Electrical, Glass & Other 159
Figure 7-11 Unrealized Scrap Volume: Rhodium,
Autocatalysts & Chemical 160
Figure 7-12 Unrealized Scrap Volume: Rhodium,
Electrical, Glass & Other 160
Figure 7-13 Realized Scrap Volume: Iridium 161
Figure 7-14 Unrealized Scrap Volume: Iridium 161
Figure 7-15 Realized Scrap Volume, Ruthenium 162
Figure 7-16 Unrealized Scrap Volume, Ruthenium 162
7.3 Slag and Mine Waste 162
Figure 7-17 PGM Slag Recovery, North America 163
Figure 7-18 Slag Recovery, North America, by Metal 164
Figure 7-19 PGM Slag Recovery, Rest of World 164
Figure 7-20 Slag Recovery, Rest of World, by Metal 165
Figure 7-21 New PGM Supply with Improved
Recovery: Platinum, Palladium, Rhodium 165
Figure 7-22 New PGM Supply with Improved
Recovery: Iridium, Ruthenium, Osmium 166
7.4 Effect of Improved Recycling and Slag Recovery on
PGM Prices 166
Figure 7-23 Conventional Price Forecast: Platinum,
Palladium, Rhodium 167
Figure 7-24 Conventional Price Forecast: Iridium,
Ruthenium, Osmium 167
Figure 7-25 Prices, with Improved Recovery: Platinum,
Palladium, Rhodium 168
Figure 7-26 Prices with Improved Recovery: Iridium,
Ruthenium, Osmium 168
7.5 Long-Term Supply Solutions: Near-Earth Asteroid
Mining 168
Order today
#PGM2 Platinum Group Metals: Issues and Opportunities
$4,300
|